


By Werner van Rossum
Most large organizations do not lack performance data. They lack the architecture to make it useful. This article introduces a three-layer enterprise KPI model, developed and implemented across a major global energy company’s finance operations, that provides a principled framework for what to measure at each level, who governs each measure, and how escalation between levels is controlled. The result is not just cleaner reporting. It is faster, clearer, higher-quality decisions.


Senior finance leaders today preside over more performance data than at any previous point in history. Enterprise resource planning platforms, cloud data warehouses, and self-service analytics tools have made it technically trivial to create new metrics, build new visualizations, and extend performance reporting into every corner of a global organization, yet the result is structural complexity rather than greater clarity.
The evidence is consistent and striking. According to the 2025 Financial Planning and Analysis (FP&A) Trends Survey, drawing on responses from hundreds of finance professionals across industries and regions, only 31% of finance team time is spent on value-added activities such as analysis and strategic insight, while 69% remains consumed by data gathering, reconciliation, and reporting.¹ Separately, only 2% of organizations consider their FP&A function fully optimized.²
This is not a technology failure. Most large organizations now have access to capable platforms. The failure is architectural. Metrics accumulate without governance, and visualizations multiply without hierarchy. Planning processes expand without structural constraint, and finance teams spend their time managing complexity rather than generating the insight it was meant to produce.
The Balanced Scorecard, introduced by Kaplan and Norton in 1992, argued that financial measures alone were insufficient to understand and steer an enterprise, and proposed four interdependent perspectives as a more complete framework for performance management.⁴ In the three decades since its introduction, the environments in which large multinational organizations operate have changed in ways the scorecard did not contemplate. Reporting volumes have increased despite better tools³, and the number of performance indicators competing for executive attention has proliferated to a level that the scorecard’s emphasis on “fifteen to twenty distinct measures” could not have anticipated.⁵
The issue is not insufficient measurement, but the absence of an enterprise KPI architecture. This article introduces a three-layer model for enterprise KPI architecture, proposing a principled distinction between three types of performance measures, each serving a different purpose, operating at a different organizational level, and governed by a different set of rules. Its central claim is that performance clarity is not achieved by improving individual metrics. It is achieved by designing the structure within which all metrics operate.
1. Why KPI Proliferation Occurs, and Why It Is So Difficult to Reverse
KPI proliferation is not the result of carelessness. In large, globally distributed enterprises, it is the expected outcome of organic growth: rational decisions made at the local level, accumulated over time, in the absence of an enterprise-level architecture to constrain them.
The sources are well understood. New business ventures require new measures, and mergers and acquisitions layer legacy reporting frameworks on top of existing ones. Modern analytics platforms have compounded this further: where publishing a dashboard once required significant IT effort, it now requires an afternoon.
Each individual addition is typically defensible. The challenge is cumulative. As the number of active metrics grows, so does the cost of maintenance – in governance overhead, in time spent on reconciliations, and in the cognitive load placed on senior leaders navigating performance reviews that have expanded in length without expanding in clarity.
There is also a structural reason why proliferation is so difficult to reverse: metrics, once created, tend to develop constituencies. A business unit that owns a KPI will resist its elimination; a governance forum reviewing dashboards has institutional inertia behind it. Addition is easy, but subtraction is structurally difficult.⁶
The consequence, at sufficient scale, is a performance management environment that has evolved into a dense network of processes, reports, and governance mechanisms not designed as a coherent structure. Automating a report or upgrading a visualization tool may improve local efficiency, but it does not reduce overall complexity or improve clarity at the enterprise level.⁷
The question is not how to measure better. It is how to design a system within which measurement serves decision-making, rather than displacing it.
The Balanced Scorecard remains the most influential framework in enterprise performance management. Its two core contributions, broadening the performance lens beyond financial results, and establishing that strategy should translate into measurable objectives, are as relevant today as they were in 1992.⁴ Enterprise KPI architecture addresses a different problem. It links measurement to decision authority and governance structure. The two are complementary, not competing.
2. Enterprise KPI Architecture: A Three-Layer Model
The three-layer model draws a principled distinction between three types of performance measures. They serve different purposes, answer different questions, operate on different timescales, and belong in different governance forums, as illustrated in Figure 1. Conflating these layers is the primary mechanism through which performance management environments become fragmented.⁹
The discipline of the model lies not in any individual tier but in maintaining the distinctions between them.
Figure 1: The Enterprise KPI Architecture Pyramid
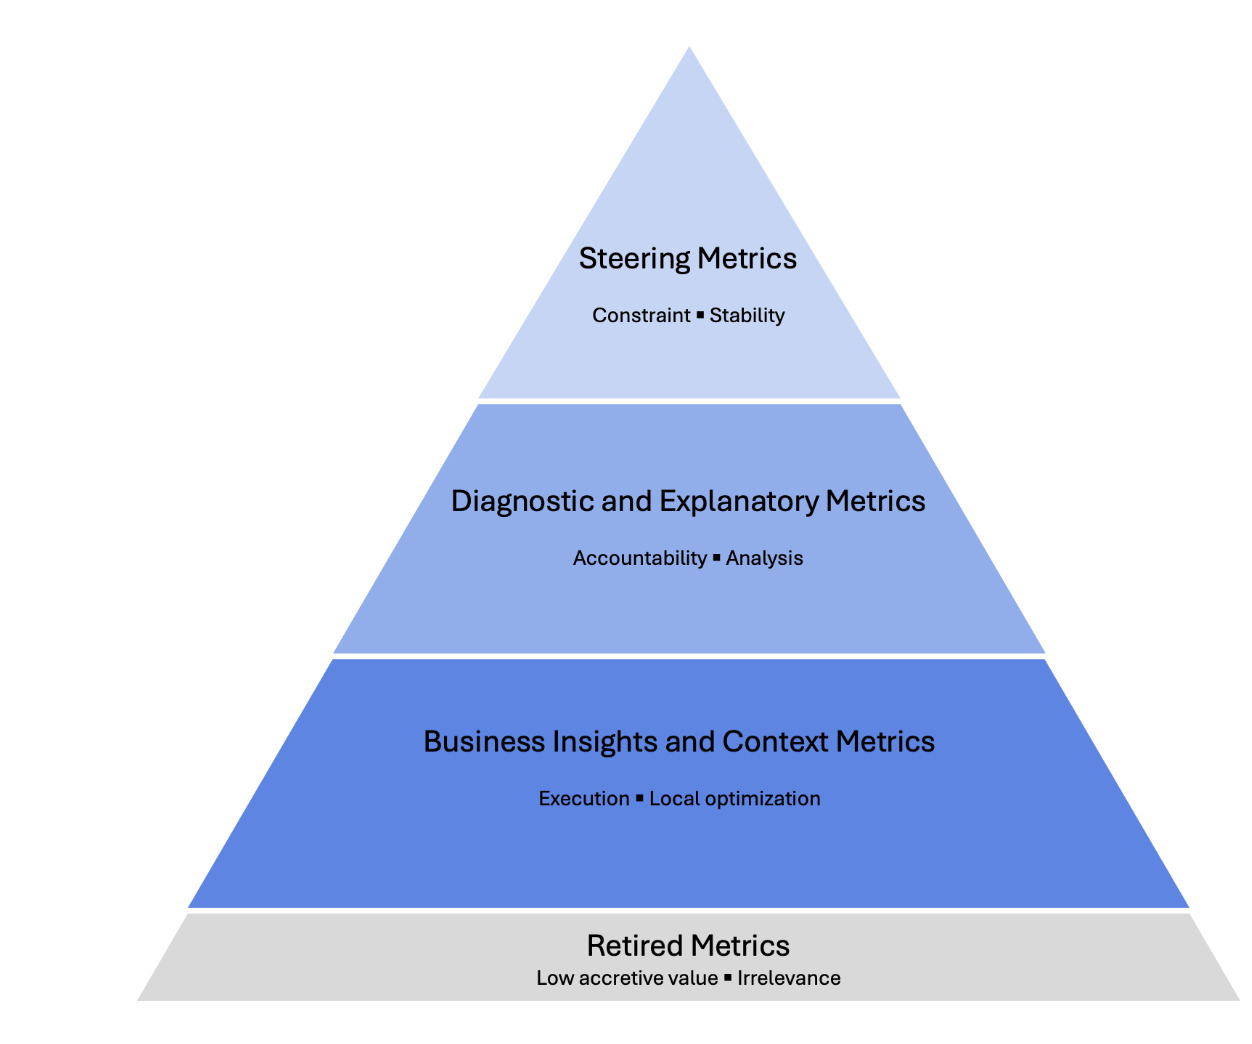
Tier 1: Steering Metrics
Steering metrics sit at the apex of the pyramid. They are limited in number, stable over time, highly standardized, and designed to answer a single question: are we winning, in line with our long-term strategic objectives?
These are the measures that matter to boards and executive committees when assessing enterprise direction and capital allocation. They typically include financial performance indicators (e.g., revenue and gross margin), operational volumes relevant to the business model, and any indicators of strategic significance at the enterprise level. Their defining characteristics are constraint and stability: they should not change with each planning cycle, and they should not automatically multiply as new business units are added. In practice, this typically means fewer than thirty measures at the enterprise level.
Tier 2: Diagnostic and Explanatory Metrics
Diagnostic metrics occupy the middle tier. Their function is decomposition: they break down steering metrics into their component drivers, enable causal analysis, and support accountability at the business unit and functional level. They answer the question: why are we winning, or why are we not?
If a steering metric signals underperformance, the diagnostic layer provides the analytical machinery to identify the source. A gross margin shortfall might be explained by realization levels, product mix, or cost escalation. Individually, these measures are too granular for senior executive visibility. Collectively, they make the steering layer meaningful rather than merely reported.¹⁰
Diagnostic metrics require harmonized definitions. A business unit in one geography and a business unit in another must define terms like net margin in the same way if the diagnostic layer is to support genuine cross-business comparison. Large multinational enterprises frequently carry legacy definitions that have diverged over years of organic growth and acquisition. Establishing definition authority, a process by which a central function can impose and enforce harmonized definitions, is a governance prerequisite for making this tier work.⁹
Tier 3: Business Insights and Context Metrics
The third tier contains operational context metrics: high-volume, rapid-cadence measures that support execution and local optimization. They answer the question: what should I do today, and where should I focus?
Examples include production efficiency, customer experience scores, and quality incident tracking. What defines them is their scope: locally relevant, operationally specific, and not automatically appropriate for enterprise-level review.
This tier is also the most at risk of inflation. Because modern platforms make building visualizations frictionless, the third tier tends to grow – and left ungoverned, it tends to migrate upward. Operational metrics appear in business unit reviews, then regional reviews, then executive reports, where they generate discussion without informing decisions.⁷ The explicit principle governing Tier 3 is simple: not every metric deserves enterprise visibility. An indicator that matters in a plant manager’s daily rhythm does not belong in a vice president’s quarterly review.
Leading and Lagging Indicators Across the Three Layers
The leading-lagging distinction does not map cleanly onto the three tiers. Financial results are predominantly lagging and typically sit in Tier 1. Operational performance measures are predominantly lagging within their own domain and typically sit in Tier 2 or Tier 3. Strategic leading indicators (e.g., customer satisfaction trends, or market share movements) may sit in any tier depending on their materiality.⁸
In each case, the tier assignment follows the decision authority principle: the measure sits at the level of the forum that can act on it. In the energy sector, for example, reserve replacement ratio and safety incident frequency serve as leading indicators at Tier 1 and Tier 2 respectively.
The key governance principle is that leading indicators require particular discipline to prevent inflation. Because they are forward-looking, they proliferate faster, often to the point where the signal is lost in the volume.¹⁰ The three-layer architecture provides the structural home within which both types should be placed, governed, and reviewed.
3. Stakeholder and Forum Mapping: Aligning Metrics to Decision Authority
A common pitfall in large enterprises is treating metric visibility as a function of organizational hierarchy rather than decision authority. The assumption that more senior leaders should see more metrics is intuitive but wrong. What senior leaders need is the right metrics, not more of them.
The three-tier model maps directly to a governance forum structure. Steering metrics belong at the board and executive committee level, where decisions concern enterprise direction and capital allocation, cascading to business and country-level organizations as the primary lens for monitoring strategic performance. Diagnostic metrics belong at the business unit and functional leadership level, where decisions concern performance drivers and operational accountability. Context metrics belong at the operational management level, where decisions concern day-to-day execution and local optimization.⁹
The principle underlying this mapping is simple but frequently violated: metrics should follow decision authority, not organizational rank. A vice president overseeing a regional business unit needs diagnostic-level metrics for that unit, not an unfiltered view of every operational context metric generated within it. When this principle breaks down, performance reviews expand in length and contract in usefulness.
Modern analytics platforms have made it technically possible for boards and executive committees to access every available metric, from the highest strategic indicators down into transactional data layers. But more information does not equate to more clarity. It leads to what might be termed data-driven confusion: a state in which the volume and complexity of available data exceeds the cognitive capacity of decision-makers to interpret and act on it, producing indecision rather than insight. The three-tier architecture is a structural defense against this fallacy.
Escalation Discipline: Preventing Metric Inflation
Mapping metrics to forums addresses the structural question of where measures belong. Escalation discipline addresses the dynamic question of what causes a measure to move.
Left without rules, metrics tend to escalate upward over time. An operational manager who identifies a concerning trend in a Tier 3 indicator will reasonably want to surface it at the next review. Once introduced into a higher-level forum, metrics tend to persist long after the original concern has been resolved. Without a principled threshold governing escalation, the upward pressure is continuous and cumulative, and every tier fills with measures that belong in the tier below.
Escalation should be governed by a metric materiality threshold: a set of criteria that must be met before a measure moves from one tier to the next. The threshold has four dimensions: financial materiality, strategic materiality, regulatory or compliance materiality, and reputational materiality. A context metric escalates to diagnostic prominence only when one or more of these criteria is clearly met. A diagnostic metric escalates to steering prominence only when the impact involves capital allocation implications or structural strategic significance.
Governance should also periodically assess the continued relevance of existing metrics. An annual review at the steering level should assess whether existing Tier 1 metrics remain the right signposts for strategic direction. As a practical discipline, organizations would do well to adopt the principle of balance: adding a new metric only when another is retired.
4. Governance Principles: The Stewardship Backbone
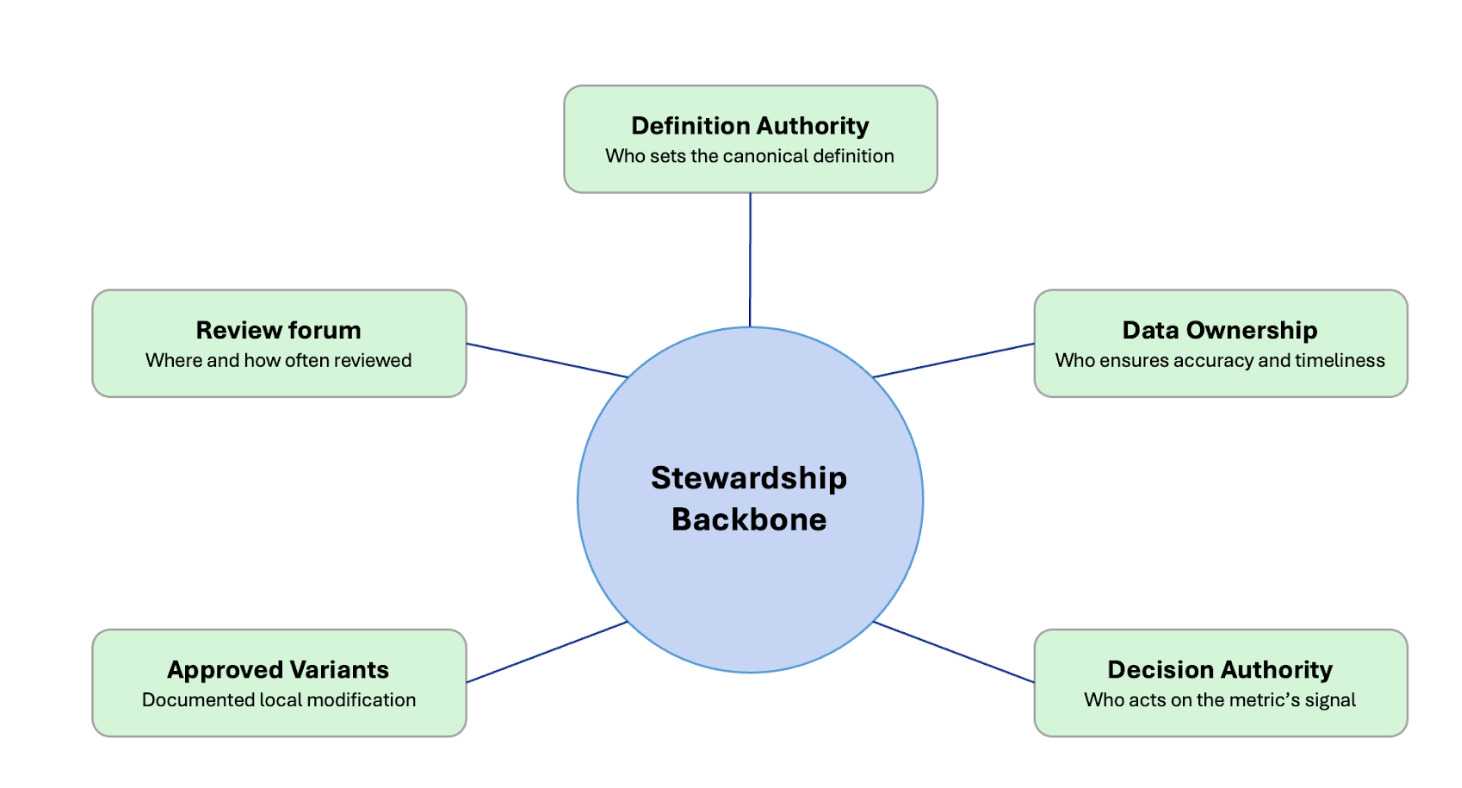
A three-tier architecture without governance infrastructure will not hold. The proliferation dynamic described in Section 1 reasserts itself the moment structural discipline is relaxed. Sustaining the architecture requires that every metric, at every tier, carries five governance attributes, summarized in Figure 2.
Definition authority: a named individual or team with the power to determine the canonical definition of the metric, including its calculation methodology and any approved exclusions. Without it, definitions drift as local teams adapt metrics to their own contexts, and the comparability that makes the diagnostic tier valuable gradually erodes.
Data ownership: a named individual or team responsible for the accuracy, completeness, and timeliness of the underlying data. The definition owner determines what is measured; the data owner ensures the measurement is reliable.
Review forum: a defined governance forum in which the metric is reviewed, with a specified frequency and a documented escalation path. A metric without a review forum is a metric no one is accountable for monitoring.
Decision authority: clarity about which role or forum has the power to act on the metric’s signal. Performance reviews without decision authority are reporting exercises, not management processes.¹¹
Approved variants: a documented register of any locally modified versions of the metric, specifying who authorized the variant and under what conditions it applies. Variants allow the system to accommodate legitimate local differences without abandoning definitional coherence.
When any one of these five attributes is absent, the architecture begins to degrade.¹² Architecture without governance collapses back into proliferation. This is the most common pitfall of KPI rationalization programs, and it is entirely preventable.
Figure 2: The Stewardship Backbone
5. Standardization and Differentiation: Where to Conform and Where to Compete
One of the practical questions that arises when designing an enterprise KPI architecture is where to standardize across businesses and where to permit differentiation. The architecture does not resolve this for any given organization, but it provides the framework within which the decision should be made.
At the steering tier, the default is standardization. Metrics serving investor communication, regulatory reporting, and board-level oversight gain their value from comparability. Where an industry standard definition exists, conforming to it reduces reconciliation costs and strengthens external credibility. Differentiation at this tier is warranted only where a distinct measure tracks a genuine and sustainable competitive advantage.
At the diagnostic tier, the balance shifts. Some metrics must be harmonized to support cross-business comparison. Others are legitimately business-specific – a refining margin decomposition will look different from a retail margin decomposition even within the same integrated energy company. The diagnostic tier should accommodate this variation, provided definitions are explicit, owned, and documented.
At the context tier, differentiation is the default. Operational metrics exist to serve local decision-making, and imposing a single set across different operational environments adds overhead without adding insight.
The principle is to standardize where comparability adds enterprise value, and differentiate where measurement is a source of local competitive insight. Organizations that over-standardize lose operational relevance at the lower tiers. Those that under-standardize find their diagnostic layer impossible to aggregate and their steering layer impossible to govern.
6. Case Illustration: From Proliferation to Architecture
The principles described in this article were developed and applied in practice during a major global finance transformation program at a large, integrated energy company. The program, one of the most significant finance modernization efforts undertaken by the organization in recent decades, was designed to consolidate legacy planning and reporting infrastructure into a unified, cloud-based analytics environment built on modern data platform and visualization technologies.
At the outset of the program, the scale of the proliferation problem was immediately apparent. The organization’s global planning and analysis processes operated with thousands of visualizations and reports, representing decades of accumulated additions from business ventures, acquisitions, transformation programs, and budget cycles that grew organically. Definitions of the same metric differed across geographies, business lines, and systems. Executive review forums at different levels of the organization each maintained their own reporting packs, often with overlapping but inconsistent content. No centralized definition authority existed. No formal retirement process was in place.
The first phase involved a structured indexing and categorization exercise across the global metric landscape. The objective was to map every active metric in use across the enterprise against the three-tier framework: what belonged at the steering level, what belonged at the diagnostic level, what belonged at the operational context level, and what should be retired. This exercise required engagement from finance, strategy, IT, and business leadership across multiple geographies, and surfaced the full extent of the proliferation.
The outcome was a reduction from thousands of visualizations and applications to approximately 150 consolidated solutions, organized around the top two tiers of steering and diagnostic metrics. At the steering tier, fewer than 30 enterprise-level metrics were established covering the full breadth of global operations, including core financial measures augmented with operational and sector-specific strategic indicators. At the diagnostic tier, more than 200 data elements were defined and harmonized across legacy and new ERP systems, establishing a unified data model that enabled genuine cross-business comparison for the first time. At the context tier, operational measures were retained where they served demonstrable local decision-making purposes, and formally retired where they did not.
The governance infrastructure to sustain the architecture was built in parallel. Definition authority was assigned explicitly, and review forum assignments were documented for every tier. A formal metric retirement process was introduced.
The financial impact extended well beyond reporting tidiness. The architectural discipline enabled lean design choices and vendor scope negotiations informed by a clear view of what was actually needed, contributing to significant cost avoidance. More significantly, it produced a performance management environment in which senior executives could review the enterprise’s strategic position in a single session, with confidence that the metrics they were seeing represented a coherent, governed, and comparable picture of global performance.
The case illustrates a broader principle. The value of enterprise KPI architecture is not measured only in reporting efficiency. It is measured in the quality of decisions that the architecture enables, and in the organizational capacity that is freed when finance teams are no longer primarily engaged in managing the complexity of their own measurement systems.
7. From Measurement to Decision Cadence
A well-designed enterprise KPI architecture does more than reduce complexity. When properly implemented, it changes the rhythm of organizational decision-making in ways that compound over time.
Performance reviews structured around the three-tier model develop a natural cadence that matches the timescale of each layer. Steering metrics support quarterly and annual strategic reviews at which boards and senior executive committees engage with questions of direction, capital allocation, and strategic risk. Diagnostic metrics, reviewed at the business unit level on a monthly or rolling basis, support the accountability conversations that connect operational reality to strategic intent. Context metrics, reviewed at weekly or daily frequencies, support the execution decisions of the people closest to the work.
The cadence matters because it aligns the frequency of measurement with the frequency of decision. An organization reviewing its steering metrics monthly with a board is not making better decisions, it is creating more reporting cycles, more preparation burden, and more opportunity for short-term complexity to distort long-term judgment. Monthly reviews at the senior executive committee level can be valuable where steering metrics genuinely inform near-term resource decisions, but this is the exception rather than the default. The three-tier architecture makes the right frequency for each layer explicit, rather than leaving it as an implicit and often contested organizational norm.
The principle of dynamic review refines this further. Metrics should surface when there is a meaningful deviation from expectation, plan, or comparable prior periods – not on a fixed schedule. A metric performing within expected parameters is not influencing a decision and does not require review. Exception-based review redirects leadership attention toward the signals that matter, and away from the confirmation of what is already known.
8. Conclusion: Architecture as Strategic Discipline
Organizations do not suffer primarily from a shortage of metrics. They suffer from a shortage of structure. The solution is not better measurement tools, though better tools will always help at the margin. It is enterprise KPI architecture: a principled, governed framework that determines what is measured at each level of the organization, who owns each measure, where each measure is reviewed, and how escalation between levels is governed.
The three-tier model is not the only possible architecture. Organizations will differ in how they draw the boundaries between tiers and how aggressively they pursue diagnostic harmonization across businesses with different operational profiles. What does not vary is the underlying logic: performance clarity is a design problem, not a data problem. The structure within which metrics operate determines whether they produce insight or confusion, whether they support decisions or displace them, and whether the investment in performance infrastructure generates organizational value or merely organizational overhead.
The arrival of artificial intelligence in the enterprise analytics stack makes this discipline more urgent, not less. AI tools applied to a well-governed, three-tier metric architecture can meaningfully enhance predictive capability, surface escalation signals earlier, and reduce the cost of maintaining the diagnostic layer. Applied to an ungoverned metric landscape, the same tools accelerate proliferation and amplify data-driven confusion. The architecture is the prerequisite, the technology the accelerant.
In an environment of elevated geopolitical uncertainty, accelerating technological change, and compressed decision windows, the capacity to generate clear, timely, decision-relevant performance signals is increasingly a source of competitive advantage. Enterprises that invest in the governance discipline to build and sustain a coherent KPI architecture will find that the return extends well beyond reporting efficiency. It compounds through every planning cycle, every board review, and every decision made with clarity rather than in the face of complexity.
The question facing most large organizations is not whether to build such an architecture. It is whether to build it deliberately, or to continue allowing it to grow by default.
About the Author
 Werner van Rossum is a senior finance and business transformation leader specializing in enterprise-scale FP&A, performance management, and analytics architecture. He has led large, multi-year enterprise finance and performance-management transformations across globally distributed organizations, focusing on aligning processes, systems, and data to improve decision quality at scale.
His work centers on designing decision-oriented FP&A and performance management frameworks that reduce complexity, strengthen governance, and enable timely, trusted insight in highly matrixed environments. He has held leadership roles spanning corporate finance, performance management, and enterprise transformation, and regularly contributes perspectives on finance transformation, KPI architecture, and organizational design.
Werner holds an MSc in International Business and has completed executive education in global leadership and transformation. He is based in the United States.
Notes
- FP&A Trends Group (2025). FP&A Trends Survey 2025: Ambition to Execution. Reported in Gobin, H. “The FP&A Analytics Playbook: Moving to Intelligent Planning.” FP&A Trends, November 11, 2025.
- FP&A Trends Group (2025). FP&A Trends Survey 2025: Ambition to Execution. Reported in Rudakova, O. “2025 FP&A Benchmarks: Where We Are, Where Leaders Are Going.” FP&A Trends, July 10, 2025.
- FP&A Trends Group (2025). FP&A Trends Survey 2025: Ambition to Execution. Reported in Rudakova, O. “2025 FP&A Benchmarks: Where We Are, Where Leaders Are Going.” FP&A Trends, July 10, 2025.
- Kaplan, R.S. and Norton, D.P. (1992). “The Balanced Scorecard: Measures That Drive Performance.” Harvard Business Review, January-February 1992.
- Kaplan, R.S. and Norton, D.P. (1993). “Putting the Balanced Scorecard to Work.” Harvard Business Review, September-October 1993.
- Franco-Santos, M., Lucianetti, L. and Bourne, M. (2012). “Contemporary Performance Measurement Systems: A Review of Their Consequences and a Research Agenda.” Management Accounting Research, Vol. 23, No. 2, pp. 79-119.
- Nieto-Rodriguez, A. (2026). “Are Legacy Metrics Derailing Your Transformation?” Harvard Business Review, February 4, 2026.
- Kaplan, R.S. and Norton, D.P. (1996). “Using the Balanced Scorecard as a Strategic Management System.” Harvard Business Review, July-August 2007 reprint.
- de Haas, M. and Kleingeld, A. (1999). “Multilevel Design of Performance Measurement Systems.” Management Accounting Research, Vol. 10, No. 3, pp. 233-261.
- Kenny, G. (2021). “KPIs Aren’t Just About Assessing Past Performance.” Harvard Business Review, September 23, 2021.
- Otley, D. (1999). “Performance Management: A Framework for Management Control Systems Research.” Management Accounting Research, Vol. 10, No. 4, pp. 363-382.
- Ferreira, A. and Otley, D. (2009). “The Design and Use of Performance Management Systems: An Extended Framework for Analysis.” Management Accounting Research, Vol. 20, No. 4, pp. 263-282.
Source link
#Designing #ThreeLayer #Performance #Model #Enterprise #European #Financial #Review


