

AlphaStreet Newsdesk powered by AlphaStreet Intelligence
Stock $423.96 (-1.0%)


EPS YoY +47.3%|Rev YoY +12%|Net Margin 17.2%
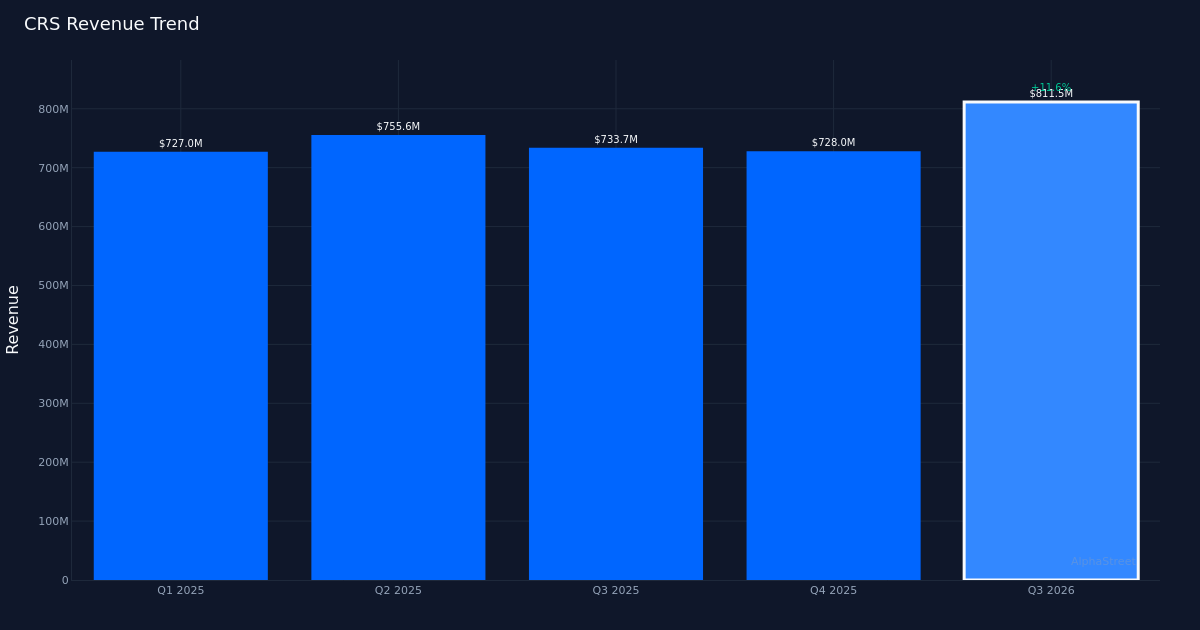
Carpenter Technology (CRS) delivered a decisive beat on both top and bottom lines in Q3 2026, but the strength beneath the headline numbers reveals an even more compelling story. The specialty metals manufacturer posted adjusted EPS of $2.77, surpassing estimates by 4.9%, while revenue of $811.5M exceeded consensus by 1.8%. More significantly, the company achieved a 47.3% year-over-year EPS expansion on just 12% revenue growth, a margin story that signals fundamental operating leverage rather than mere volume gains.
The quality of these earnings stands out immediately when examining margin progression. Net margin expanded to 17.2% from 16.7% a year ago, while operating margin reached 23.0% in the quarter. This margin expansion against a backdrop of 12.0% revenue growth demonstrates that Carpenter isn’t simply riding volume tailwinds—the company is extracting substantially more profit from each dollar of sales. The $139.6M in net income represents a 46% increase over the year-ago figure of $95.4M, outpacing the 12% revenue growth rate and confirming that operational efficiency improvements are driving the earnings acceleration. Management emphasized this achievement, noting: “The ability to increase earnings by 20% sequentially over what was a record quarter and in a market that is still accelerating must be recognized as superior performance.”
Sequential momentum appears robust when viewed through the four-quarter lens. Revenue progression shows Q3 2026 at $811.5M, representing a substantial step-up from Q4 2025’s $728.0M and Q3 2025’s $733.7M, though Q2 2025 registered $755.6M, creating a mixed pattern. The critical observation lies in net income trajectory: $139.6M in Q3 2026 marks a clear acceleration from $95.4M a year prior, $111.7M in Q2 2025, and $117.3M in Q4 2025. This ascending profit pattern despite uneven revenue trends reinforces the margin expansion narrative—Carpenter has cracked the code on converting sales into profit more efficiently than it did throughout 2025.
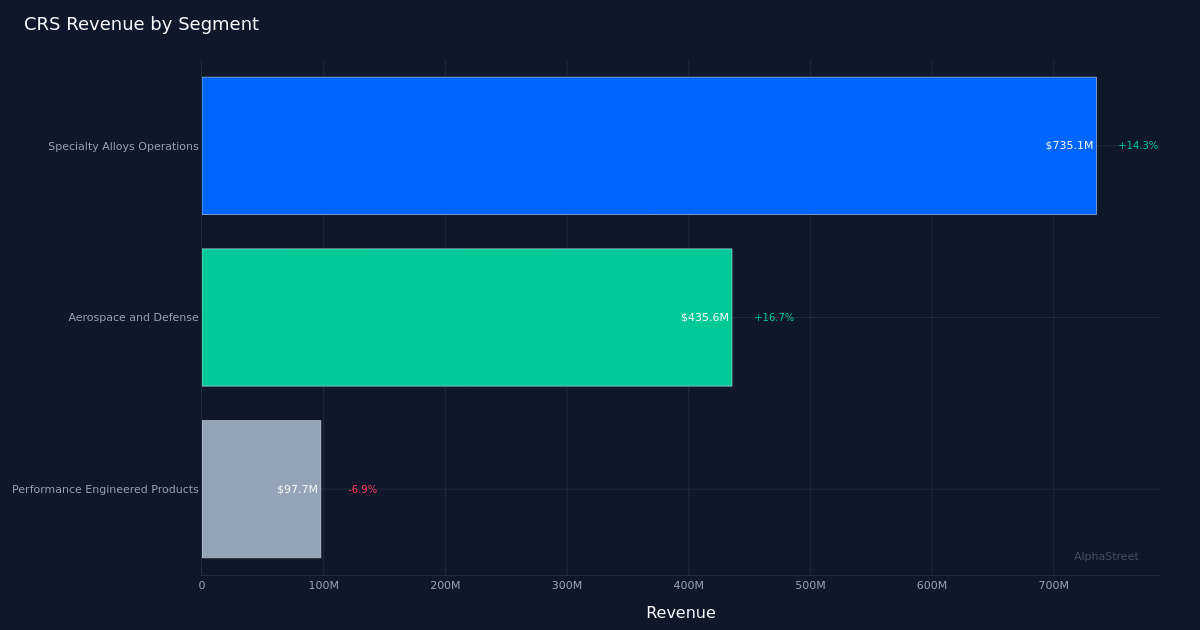
Segment performance reveals a stark bifurcation that merits close attention. Specialty Alloys Operations generated $735.1M with impressive 14.3% growth, representing over 90% of total revenue and clearly serving as the company’s primary growth engine. The segment’s operating margin of 35.6% stands as a remarkable achievement in the capital-intensive metals fabrication industry. Management highlighted this milestone: “The SAO segment delivered an adjusted operating margin of 35.6% in the quarter, another new record for the business.” In contrast, Performance Engineered Products posted $97.7M, with a concerning 6.9% decline. The divergence suggests Carpenter’s fortunes are increasingly tied to its specialty alloys business, with the aerospace and defense end market driving much of the strength at $435.6M and 16.7% growth. Management noted continued momentum in key categories: “So still see very strong sales on the, on the engine side fasteners were up 9 or 10% sequentially, about 20% year over year.”
Volume metrics provide additional texture to the growth story. The company sold 53.5 million pounds in the quarter. The combination of 12.0% revenue growth and significant margin expansion suggests Carpenter is achieving both volume gains and favorable pricing/mix. The aerospace and defense vertical’s 16.7% growth indicates the company is well-positioned in high-value applications where technical specifications and quality certifications create switching costs and pricing power.
The market’s muted reaction—shares were largely unchanged following the report—suggests investors may have already priced in much of this strength. The 100% beat rate over the last quarter indicates consistency, but a single-quarter track record provides limited insight into how often Carpenter exceeds expectations. The stock’s stability despite record earnings and margin performance could reflect either full valuation or skepticism about sustainability, particularly given the Performance Engineered Products segment’s contraction.
Management’s tone conveyed confidence in the durability of current trends. The emphasis on sequential improvement over an already-record quarter signals that leadership views this performance as reflecting structural improvements rather than cyclical peaks. The 35.6% operating margin in Specialty Alloys Operations represents a level that would have seemed ambitious in prior cycles, yet management’s commentary suggests continued room for optimization: “As you’ve seen, we’ve delivered steady increase in SAO margins and we’re very happy with the efforts of the commercial and OPER teams to achieve the 35.6% this quarter.”
What to Watch: The sustainability of 35.6% operating margins in Specialty Alloys Operations will be critical—any compression would signal pricing pressure or cost inflation. Monitor whether Performance Engineered Products can stabilize or if the 6.9% decline represents the start of structural headwinds. Aerospace and defense growth trends deserve close tracking given this vertical’s 16.7% expansion and apparent pricing power. Free cash flow conversion relative to net income will indicate whether working capital is absorbing growth or if the business model generates clean cash. Finally, watch for any shifts in pounds sold sequentially, as volume trends will reveal whether demand strength persists beyond favorable pricing and mix effects.
This content is for informational purposes only and should not be considered investment advice. AlphaStreet Intelligence analyzes financial data using AI to deliver fast and accurate market information. Human editors verify content.
Source link
#Carpenter #Technology #EPS #Tops #Estimates #Deep #Dive #Alphastreet


